Food Safety Audit Dashboard
Turns a 178-row audit spreadsheet into department, PRP and closure-performance analytics.
- Power BI
- DAX
- Star Schema Data Modeling
- Power Query
- Status
- Delivered, not maintained. All 8 commits landed on 2025-07-09 as bulk "Add files via upload" pushes; the .pbix and screenshots are dated 28–29 June 2025 and the source workbook 22–27 June 2025. No activity since. Repository is public and not archived.
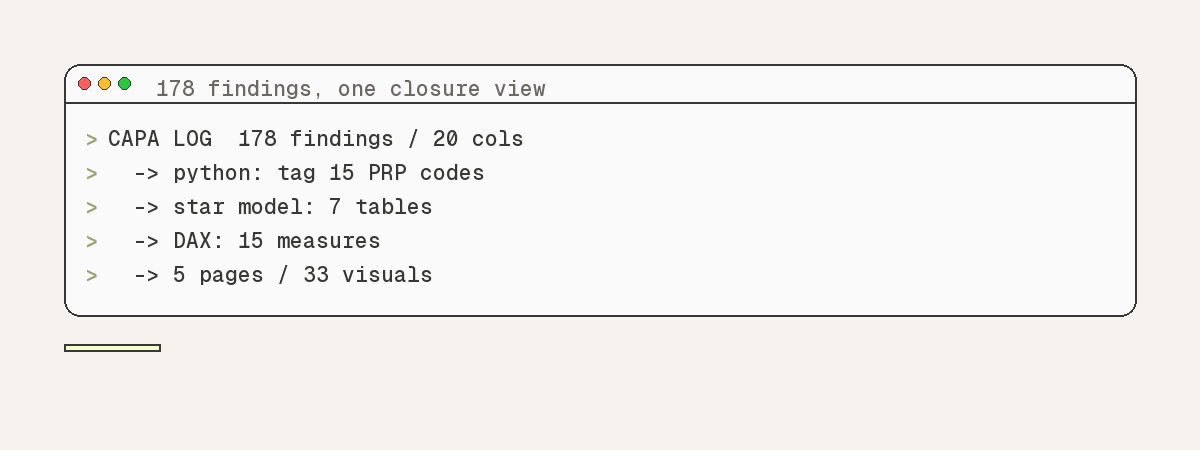
By the numbers · 9
178
Audit findings tracked
20
Fields captured per finding
15
DAX measures
7
Tables in the data model
5 pages / 33 visuals
Report surface
15
Prerequisite programme categories mapped
517
PRP tag occurrences resolved across findings
~75
Departments and production areas covered
16 Jan – 22 Apr 2025
Audit window in the dataset
Summary
A Power BI reporting layer over a food-safety audit CAPA register (corrective and preventive actions raised against FSSC 22000 and ISO 9001). A Python step tags each finding with the prerequisite-programme codes it violates, and Power BI loads the enriched sheet into a seven-table model with dedicated date and PRP dimensions plus a measures-only table holding fifteen DAX measures. Five report pages split the analysis into overview, non-conformance root cause, prerequisite programme, and closure timeliness, so a flat log becomes a queryable view of which areas repeat failures and which corrective work is running late.
The problem
A food and beverage manufacturer audits its plant against FSSC 22000 and ISO 9001, logging every non-conformance and the corrective action assigned to fix it. That record lived in one flat spreadsheet: 178 findings spread across roughly 75 departments and production areas, each carrying twenty fields, many of them left blank. In that form the quality team could read individual rows but could not see which areas repeat the same failures, which prerequisite programmes are weakest, or how much corrective work is actually closing on time. The dashboard exists to answer those three questions.
Approach
Profiled the source register first: 178 findings carrying a tracking number, 20 fields each, audit dates spanning 16 January to 22 April 2025, across roughly 75 distinct departments and production areas (QC Lab, TetraPak line, PET line, batching, pest management).
Handled the prerequisite-programme mapping upstream in Python rather than in the report, the delivered workbook `capa_with_prps.xlsx` is authored by openpyxl and carries a pre-resolved `PRPs from PRP sheet` column, so each finding arrives already tagged with the PRP codes it violates.
Modelled the data dimensionally instead of reporting off one flat sheet: a `DateTable` dimension (Date, Month, Quarter, Year) and a `PRPs` dimension (PRP_Code, PRP_Name) feed the `capa log` fact table, alongside `cp_2`, `Sheet1` and `Audit`.
Isolated all reporting logic in a dedicated measures-only table named `measure`, keeping the fifteen DAX measures out of the fact tables.
Built the measure set to cover five different questions: volume (TotalNCR_RCA, UniqueAuditCount), severity (Critical, Major, Minor, Recommendation), lifecycle state (Closed, Pending, NCR_RCA_NotStarted), audit throughput (CompletedAudits, PendingAudits, TotalPlannedAudits) and timeliness (NCR Closed On Time, NCR Closed Late), plus a composite PRP_Score.
Split the report into five pages, Audit Overview, NCR/RCA Analysis, PRP Analysis, Closure Analysis and a raw detail table, totalling 33 visuals and 15 slicers bound to shared Month, Quarter, Year, Area and Assignee fields so filters behave consistently across pages.
Used a PRP-by-month matrix with conditional shading on the PRP Analysis page so repeat offenders (technical training, product coding and labelling) surface without the reader having to sort anything.
Shipped the .pbix with five rendered page screenshots committed alongside it, so the report can be reviewed without a Power BI licence.
Architecture
Excel CAPA log + PRP reference sheetPython/openpyxl PRP taggingcapa_with_prps.xlsxPower Query import7-table tabular model (capa log fact + DateTable/PRPs dimensions)`measure` table with 15 DAX measures5-page Power BI report (33 visuals, 15 slicers)
| Component | Role |
|---|---|
| Source CAPA register (Excel) | Flat audit log: 178 findings, 20 fields each, tracking number, standard/clause, audit team, area and owner, non-compliance description, root cause, priority, corrective action, assignee, due/start/closure dates, status, evidence and effectiveness verification. |
| Python enrichment step (openpyxl) | Joins prerequisite-programme codes onto each finding and emits `capa_with_prps.xlsx`. Evidenced by the workbook's `dc:creator` of openpyxl and the derived `PRPs from PRP sheet` column; the script itself is not in the repository. |
| capa log (fact table) | Grain is one audit finding. Carries area, owner, assignee, audit team and the four lifecycle dates that drive closure analysis. |
| DateTable (dimension) | Conformed calendar exposing Date, Month, Quarter and Year; backs the shared time slicers on every page. |
| PRPs (dimension) | PRP_Code to PRP_Name lookup across 15 prerequisite-programme categories (A-2.1 Building Interior through G-1.1 Allergen Control Program). |
| cp_2, Sheet1, Audit (supporting tables) | Additional related tables in the model, a status/date projection, a priority-and-PRP projection keyed by tracking number, and an audit-planning table carrying Budget, Deadline, Duration and Estimated hours. |
| measure (measures-only table) | Holds all 15 DAX measures: TotalNCR_RCA, UniqueAuditCount, Closed, Pending, NCR_RCA_NotStarted, Critical, Major, Minor, Recommendation, CompletedAudits, PendingAudits, TotalPlannedAudits, NCR Closed On Time, NCR Closed Late, PRP_Score. |
| Report layer | Five pages, Audit Overview, NCR/RCA Analysis, PRP Analysis, Closure Analysis, and a raw detail table, comprising 33 visuals and 15 slicers. |
Trade-offs
Chose
A dedicated measures-only table (`measure`) holding all fifteen DAX measures
Over
Attaching measures to the fact tables they aggregate
The model spans seven tables and several measures read across more than one of them; centralising them keeps the field list navigable and stops measure ownership from being tied to whichever table happened to be the source.
Chose
An explicit `DateTable` dimension exposing Date, Month, Quarter and Year
Over
Power BI's automatic per-column date hierarchies
Month, Quarter and Year slicers are reused across pages and must filter every fact consistently; auto hierarchies would create a separate implicit calendar per date column, and the register has four (Audit, Start, Due, Closure).
Chose
Resolving PRP tagging in Python before load, shipping `capa_with_prps.xlsx`
Over
Performing the PRP lookup in Power Query or DAX
A single finding can violate several prerequisite programmes, 517 PRP tag occurrences resolve across 178 findings, so the mapping was flattened upstream and the report consumes an already-tagged column.
Chose
Five narrow report pages, each answering one question
Over
One dense executive dashboard
Overview, root-cause, prerequisite-programme and closure-timeliness analyses need different grains and different slicers; splitting them let each page carry only the filters relevant to it rather than a shared wall of fifteen.
At scale
178 audit findings, each with up to 20 tracked fields, covering audits dated 16 January to 22 April 2025.
Roughly 75 distinct departments and production areas appear in the register, spanning QC Lab, TetraPak and PET line operations, batching, warehousing, pest management, engineering, HR and IT.
15 prerequisite-programme categories with 517 total tag occurrences resolved across the findings, technical training (D-1.2, 134 occurrences) and general food hygiene training (D-1.1, 82) dominate.
The tabular model contains 7 tables and 15 DAX measures held in a dedicated measures-only table.
The report comprises 5 pages and 33 visual containers, 15 of which are slicers bound to shared Month, Quarter, Year, Area and Assignee fields.
Source data is genuinely incomplete, and the model had to tolerate it: of 178 findings only 123 carry a Status, 129 a Priority, 113 a Due Date, 56 a Start Date and 41 a Closure Date; 51 rows are marked Closed but only 40 of those have a closure date.
24 distinct audit-team entries and 51 distinct corrective-action assignees appear in the register.
8 commits, all pushed on 2025-07-09 as bulk file uploads; the underlying files are dated 22–29 June 2025.
My role
Sole developer on a freelance BI engagement, data preparation, dimensional modelling, DAX and report design. Evidenced by the repository owner (munib123), the workbook's `lastModifiedBy` of "Muneeb Shafiq", and the original authoring path `C:\Users\PMLS\OneDrive\Desktop\bi_freelance\` recorded in the workbook XML.