Onboarding Pass-Rate Forensics
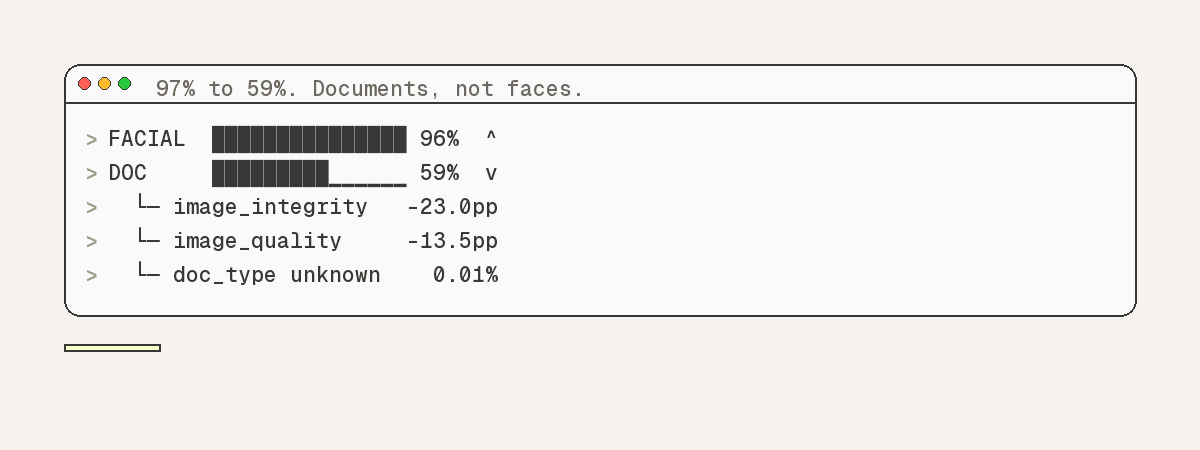
Isolated a 97%-to-59% onboarding pass-rate collapse to document image quality, clearing biometrics.
- pandas
- NumPy
- Matplotlib
- seaborn
- Status
- Complete one-off deliverable, not under active development. All 7 commits pushed 2025-12-28; no commits since. Repository is public and not marked archived on GitHub.
By the numbers · 8
176,404
verification records in each of the two check reports
96.7% to 59.1%
document-check pass rate, June to October 2021
87.1% to 96.2%
facial-check pass rate over the same window, rising, not falling
-23.0 pp
image-integrity pass-rate drop, first half vs second half of the window
-13.5 pp
image-quality pass-rate drop over the same comparison
0.01%
pass rate for the 26,106 records whose document type could not be extracted (3 of 26,106 cleared)
13
document-check verdict columns tracked month by month
209 / 169
nationalities and issuing countries segmented from the nested metadata field
Summary
A root-cause investigation into a six-month decline in identity-verification pass rate, run across 176,404 document checks and 176,404 facial-similarity checks. The analysis is deliberately staged: first isolate which of the two funnel stages moved, then decompose that stage into its thirteen underlying verdict columns, then segment by the metadata those checks emit. That ordering is what makes the conclusion defensible, the biometric stage is cleared before any document-level claim is made, and the segmentation then exposes the mechanism by which an unreadable image becomes an automatic rejection.
The problem
A digital onboarding funnel asks every new applicant to photograph an identity document and then take a selfie. The share of applicants clearing both steps, the team's headline pass rate, had been sliding for months, and nobody could say whether the cause was tougher fraud, a worse applicant mix, or the product itself. Every failed applicant is a customer who never opens an account, so the answer determined who owned the fix: the risk team, the verification vendor, or the mobile capture screen.
Approach
Loaded both check exports, normalised created_at to UTC datetimes and derived a monthly period key, establishing a window of 2021-05-23 to 2021-10-31 across six months.
Computed monthly clear/consider counts and pass rates for each funnel stage separately, showing document checks falling from 96.70% (June) to 59.15% (October) while facial checks rose from 87.12% to 96.16%, isolating the decline to a single stage before making any claim about it.
Decomposed the document stage into thirteen verdict columns and recomputed monthly rates for each, excluding nulls from the denominator because column coverage ranges from 176,403 populated rows (image integrity) down to 2,548 (data comparison).
Ranked every check by first-half-versus-second-half movement: image integrity (-23.0 pp) and image quality (-13.5 pp) were the only checks moving anywhere near the headline result (-20.8 pp), while the fraud checks, police record and compromised document, held flat at effectively 100%.
Parsed the nested properties field, which is exported as single-quoted Python dict text rather than JSON, into nationality, document type, gender and issuing country, yielding 209 nationalities, 169 issuing countries and 9 document types.
Computed segment pass rates under a minimum-sample filter and cross-tabulated issuing country against document type, showing the decline is not concentrated in a nationality or document cohort (spread across nationalities is only 5.1 percentage points of standard deviation).
Identified the causal mechanism: 26,106 records whose document type could not be extracted pass at 0.01%, and 55,836 records with unextractable gender pass at 49.0% against an ~87% baseline, a failed image blocks field extraction, and missing mandatory fields force an automatic reject.
Wrote the result as a four-page deliverable with executive summary, methodology, evidence and three prioritised recommendations: real-time capture guidance in the UI, a review of image-quality thresholds, and device-level segmentation of integrity failures.
Architecture
Two identity-verification check exports (CSV)pandas load, UTC datetime normalisation, monthly period keystage isolation (document vs facial pass rate)per-check decomposition across 13 verdict columns with null-aware denominatorsnested properties field parsed into nationality / document type / gender / issuing countrymin-sample-filtered segment and cross-tab pass rates28 matplotlib and seaborn figures4-page written findings and recommendations
| Component | Role |
|---|---|
| Data/Facial-similarity-check-report.csv | Committed facial-check export: 176,404 rows, 10 columns of per-attempt verdicts (result_facial, face_comparison_result, facial_image_integrity_result, visual_authenticity_result) keyed by hashed user_id and attempt_id. |
| trend_mnth.ipynb | Stage isolation. Computes monthly clear/consider counts, pass and fail rates and check volume for both stages, plus a first-half-versus-second-half trend test that flags document checks declining and facial checks improving. 11 cells. |
| dcmnt_cols.ipynb | Per-check decomposition. Recomputes monthly rates for all 13 document-check verdict columns with nulls removed from the denominator, then renders a check-by-month pass-rate heatmap and a summary table ranking every check by percentage-point movement. 11 cells. |
| properties.ipynb | Segmentation. Parses the nested properties field into nationality, document type, gender and issuing country, computes min-sample-filtered pass rates for each, cross-tabulates issuing country against document type, and builds a nine-panel summary dashboard. 22 cells. |
| Graphs/ | 28 committed PNG figures: trend lines, pass/fail bar pairs, per-check quality/validation/security panels, country-by-document-type heatmap, nationality rankings and summary dashboards. |
| Analysis.pdf | The deliverable. Four pages: executive summary, methodology, findings (stage isolation, root cause, extraction-failure consequence) and three prioritised recommendations. |
| data_info.txt / data_info_2.txt | Column dictionary mapping each verdict column to what it actually checks (screen-replay detection, MRZ consistency, police-database flags, liveness), plus the pandas .info() output for both exports. |
Trade-offs
Chose
Excluding null verdicts from each check's rate denominator
Over
Treating a missing verdict as a failure
column coverage varies from 176,403 populated rows for image integrity down to 2,548 for data comparison, so counting nulls as failures would have made every sparsely populated check look like it was collapsing. Evidenced in dcmnt_cols.ipynb: valid_count = monthly['total'] - monthly['null_count'].
Chose
A minimum-sample floor of 100 records per segment (50 for document types)
Over
Ranking all 209 nationalities and 169 issuing countries
the long tail of low-volume nationalities would otherwise dominate the top and bottom of every ranking with statistically meaningless rates. Evidenced in properties.ipynb: calculate_pass_rate(df, col, min_samples=100).
Chose
ast.literal_eval with a json.loads fallback for the nested properties column
Over
A strict JSON parser
the field is exported as single-quoted Python dict text, not valid JSON, and a strict parser would have silently dropped every row. Evidenced in properties.ipynb: parse_properties().
Chose
Keeping unparseable metadata as an explicit 'Unknown' segment
Over
Dropping rows whose properties could not be read
the Unknown segment is the finding, 26,106 records with no extractable document type pass at 0.01%, which is the link between image failure and automatic rejection. Dropping them would have hidden the causal mechanism entirely. Evidenced in properties.ipynb (.get(field, 'Unknown') defaults) and Analysis.pdf section 3.3.
At scale
176,404 rows in each of the two check exports, covering 2021-05-23 to 2021-10-31, six calendar months (trend_mnth.ipynb cell 3 stdout).
Monthly check volume ranges from 1,739 (May 2021) to 57,957 (October 2021), a 33x swing that the analysis reports alongside the rate decline rather than conflating with it (trend_mnth.ipynb cell 5).
13 document-check verdict columns tracked month by month; 12 of them carry at least 45,506 populated rows, while data_comparison_result carries only 2,548 (dcmnt_cols.ipynb cell 10 'Valid Records' column).
209 nationalities, 169 issuing countries and 9 document types extracted from the nested properties field (properties.ipynb cell 3).
Document type volumes: 54,613 national identity cards, 50,492 driving licences, 42,228 passports, 2,929 residence permits, plus 26,106 unidentifiable (properties.ipynb cell 4).
28 committed PNG figures in Graphs/, plus a 4-page written findings document (Analysis.pdf).
Three notebooks totalling 44 cells (11 + 11 + 22).
Committed dataset weighs 21.6 MB (Data/Facial-similarity-check-report.csv).
My role
Sole author. All 7 commits (all dated 2025-12-28) are authored by Muneeb S. Covers the full scope: analysis design and sequencing, all three notebooks, the 28 figures, and the client-facing written report with its recommendations.